


How to Create a Marimekko Chart in PowerPoint (Mekko Chart Guide)
If you spend any time in strategy consulting or business analytics, you have almost certainly come...
If you’ve ever needed to explain how you get from one number to another - revenue to EBITDA, budget to actuals, cost baseline to final spend, you might have used a Waterfall chart. Waterfall charts are commonly used in consulting, finance, and strategy because they're a great way to depict positive and negative drivers over a period of time (e.g. to show changes in headcount, financial performance, customer churn).
This guide walks you through how to create waterfall charts in PowerPoint. It covers multiple options - including the built‑in PowerPoint Waterfall chart, Excel Waterfall charts that can be imported to PowerPoint as well as more manual fully custom designs.
A Waterfall chart is a data visualization that depicts how something changes - typically over a period of time. Waterfall Charts are used to provide quantitative context to the story about how and why the number has changed.
You start with a value on the first bar. Each subsequent bar shows the increase or decrease to the initial value. The final bar shows the ending total, after all changes are applied. Waterfall charts are commonly used in consulting. Some consulting firms refer to Waterfall Charts by other names - including Bridge Charts, Step Charts, Cascade Charts, Cumulative Charts and Mario Charts (a reference to the charts looking similar to Mario's steps in the Nintendo game!).
Waterfall charts in Vertical (column) format are commonly used for time-series data (eg to show changes over a monthly/ quarterly/ yearly basis). Waterfall charts in Horizontal (bar) format are less commonly used, but are good if your series has long category labels. Note that PowerPoint, Excel and Power BI default to Vertical format Waterfall Charts.
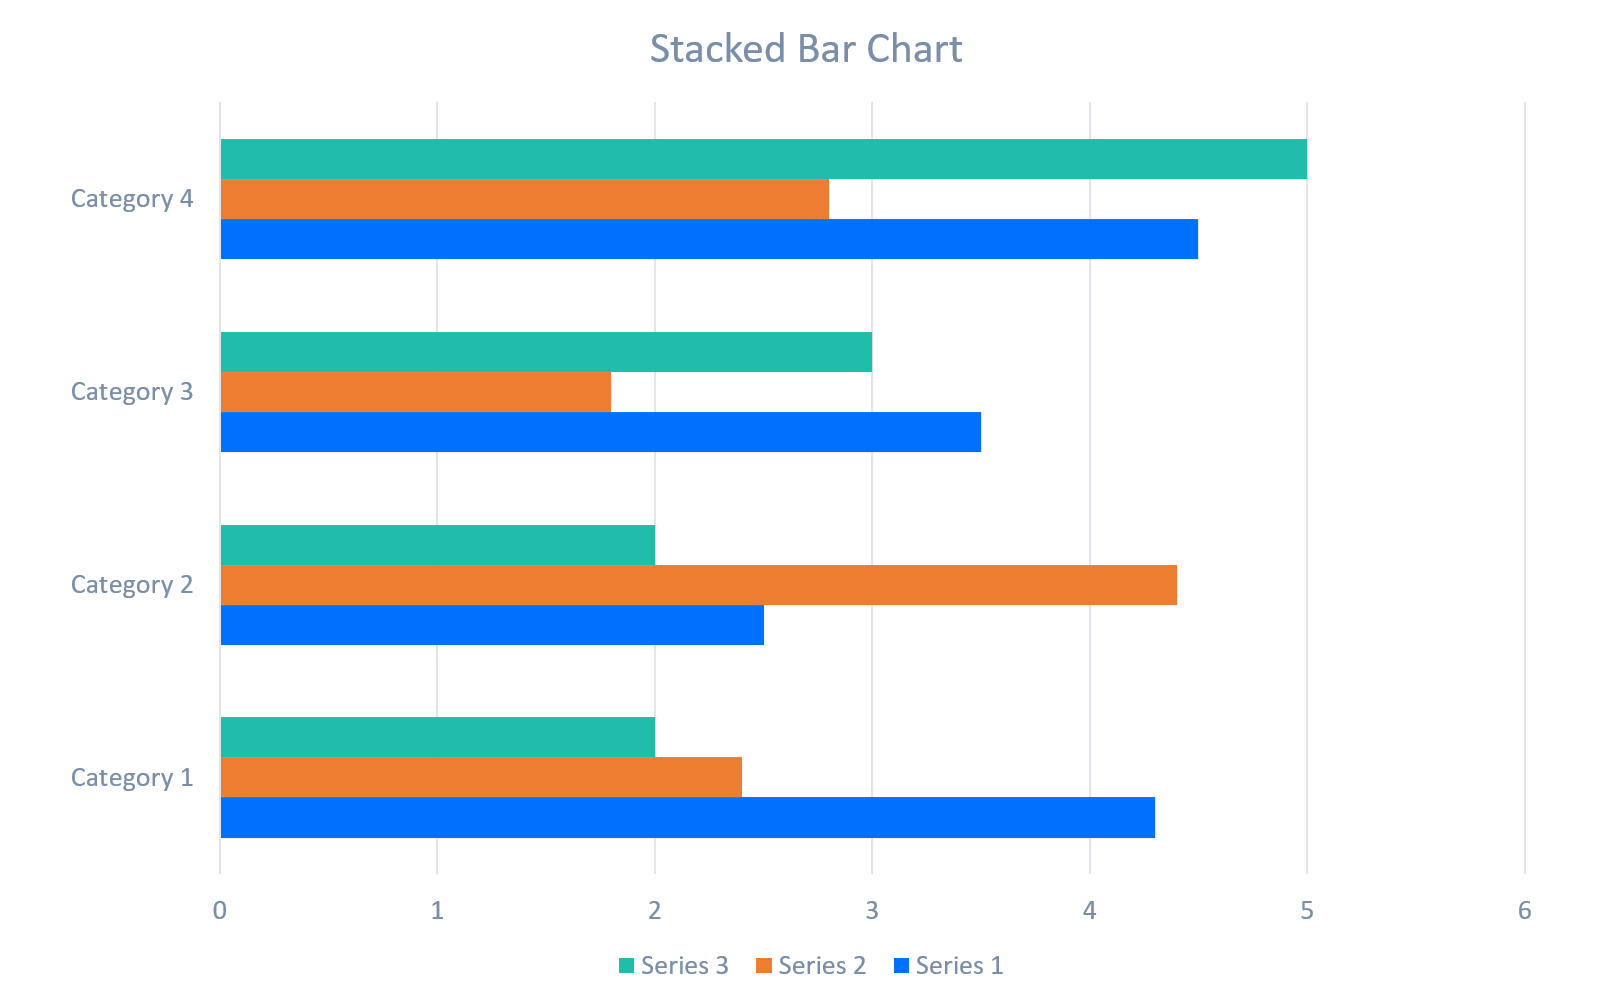
Its important to note that Waterfall charts are not to be confused with Column Charts or Bar Charts. The main difference between a Waterfall Chart vs a Column Chart or Bar Chart is the information depicted in a Waterfall chart to highlight the change to values over time rather than the cumulative. It might be useful to refer to the following images which are examples of Column Charts, Stacked Column Charts, Bar Charts and Waterfall Charts.


PowerPoint includes a native Waterfall chart type, which makes it easy to build a clean, functional waterfall without manual calculations. When you select this option, an Excel sheet will load from within PowerPoint allowing you to edit the data. The standard PowerPoint Waterfall chart is a quick option, but it is quite limited in terms of the formatting options available.
Step‑by‑Step: PowerPoint’s Built‑In Waterfall Chart
Strengths
Limitations
If your data is more complex (or perhaps you prefer Excel’s calculation tools!), you can create a Waterfall Chart in Excel and paste it into PowerPoint.
Step‑by‑Step: Excel Waterfall → PowerPoint


Strengths
Limitations
For consulting slides, you may want more control than the built‑in PowerPoint Waterfall chart or Excel chart options support. This method uses rectangles, lines, and text boxes to build a fully custom PowerPoint Waterfall chart. It's more time consuming than the other options, but it lets you fully customize the appearance of your Waterfall Chart.
Step‑by‑Step: Manual Waterfall Chart Using Shapes
Strengths
Limitations
Before PowerPoint introduced the native Waterfall chart, consultants typically created Waterfall Charts in PowerPoint by customizing stacked column charts. This method still works if you need precise control over the bar offsets (bar offsets are the starting points for each 'floating' value in a Waterfall Chart.

Step‑by‑Step: Stacked Column Waterfall Chart
Strengths
Limitations
PPT Productivity is a timesaving PowerPoint add-in. The PPT Productivity are working on new Charts features to streamline Waterfall and other chart types in PowerPoint. Contact us to request an update when the Charts features are released!

Start your 30 day free trial - Microsoft Office for Windows
Start Free Trial
