


How to change all fonts in PowerPoint: Step by Step guide
Trying to work out how to change all the fonts in PowerPoint? Issues with inconsistent fonts? This...
Timelines are a great way to represent visually a sequence of events, such as project milestones or events in PowerPoint presentations. But creating a timeline slide for your presentation from scratch is time consuming. In this blog we cover three options:
Note - if you're looking to create a more detailed timeline for project planning with actual workstreams and tasks, we recommend reading our guide to creating Gantt Charts in PowerPoint.
PowerPoint's SmartArt has process templates that you can use to create a timeline. Here are the steps to create a timeline in PowerPoint using SmartArt
Open your PowerPoint presentation and navigate to the slide where you want to add your timeline. If you're starting fresh, go to Insert > New Slide and select a blank layout.
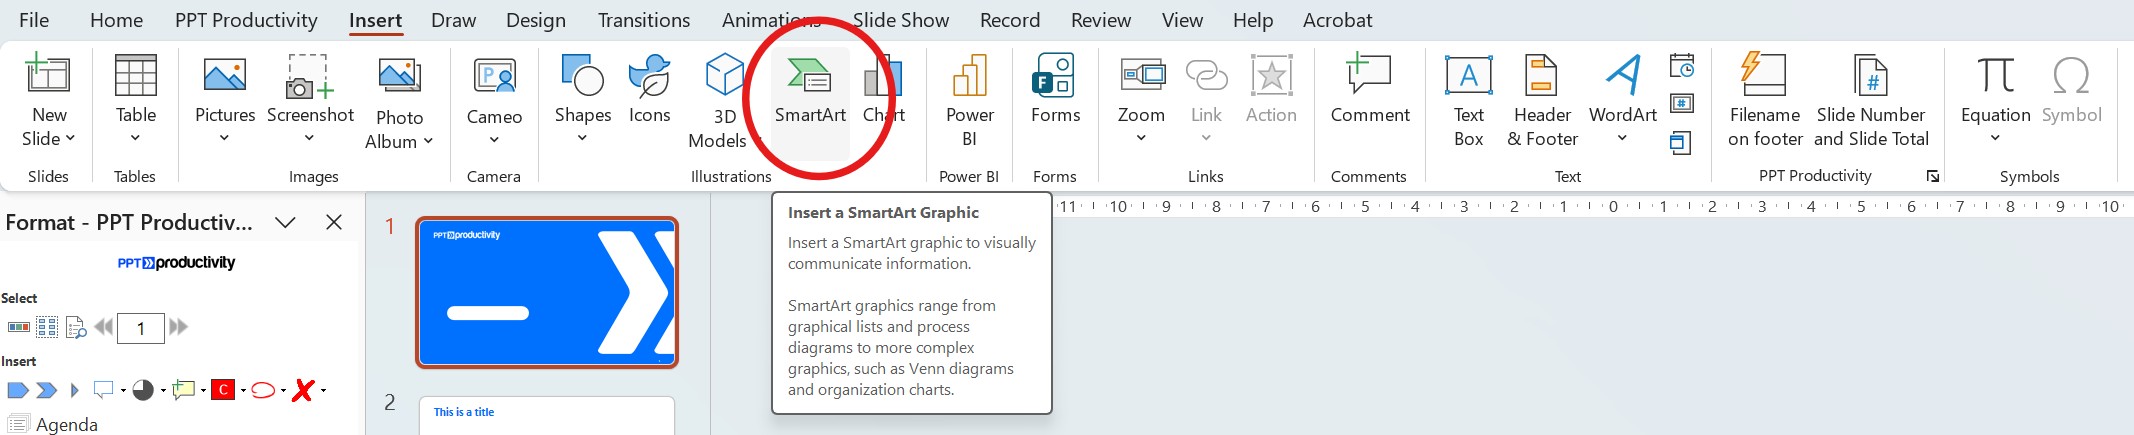
Go to the Insert tab in the PowerPoint ribbon, then click SmartArt in the Illustrations group.
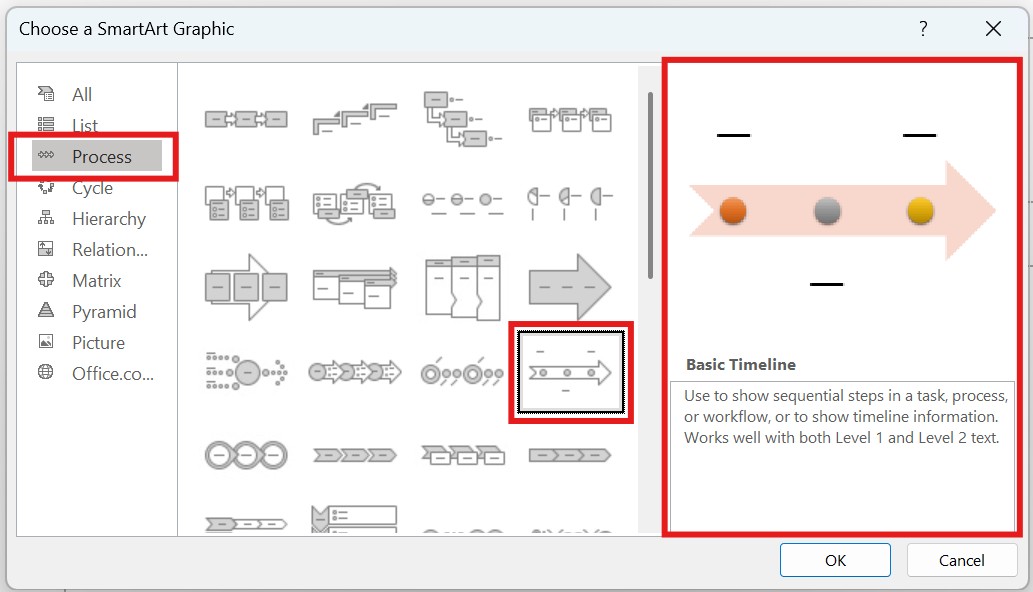
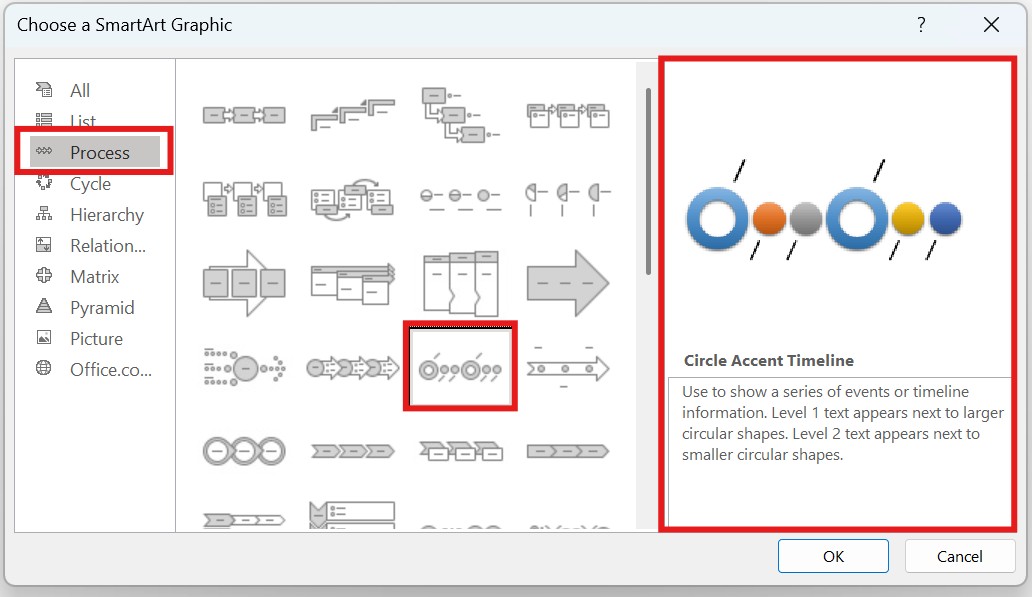
In the SmartArt graphic gallery that appears, click on the Process category in the left-hand panel. Scroll through the options (the options are admittedly limited). For most presentations, Basic Timeline is probably the best of the SmartArt options, or the Circle Accent Timeline. Once you have selected your preferred option, click OK to insert the timeline onto your slide.
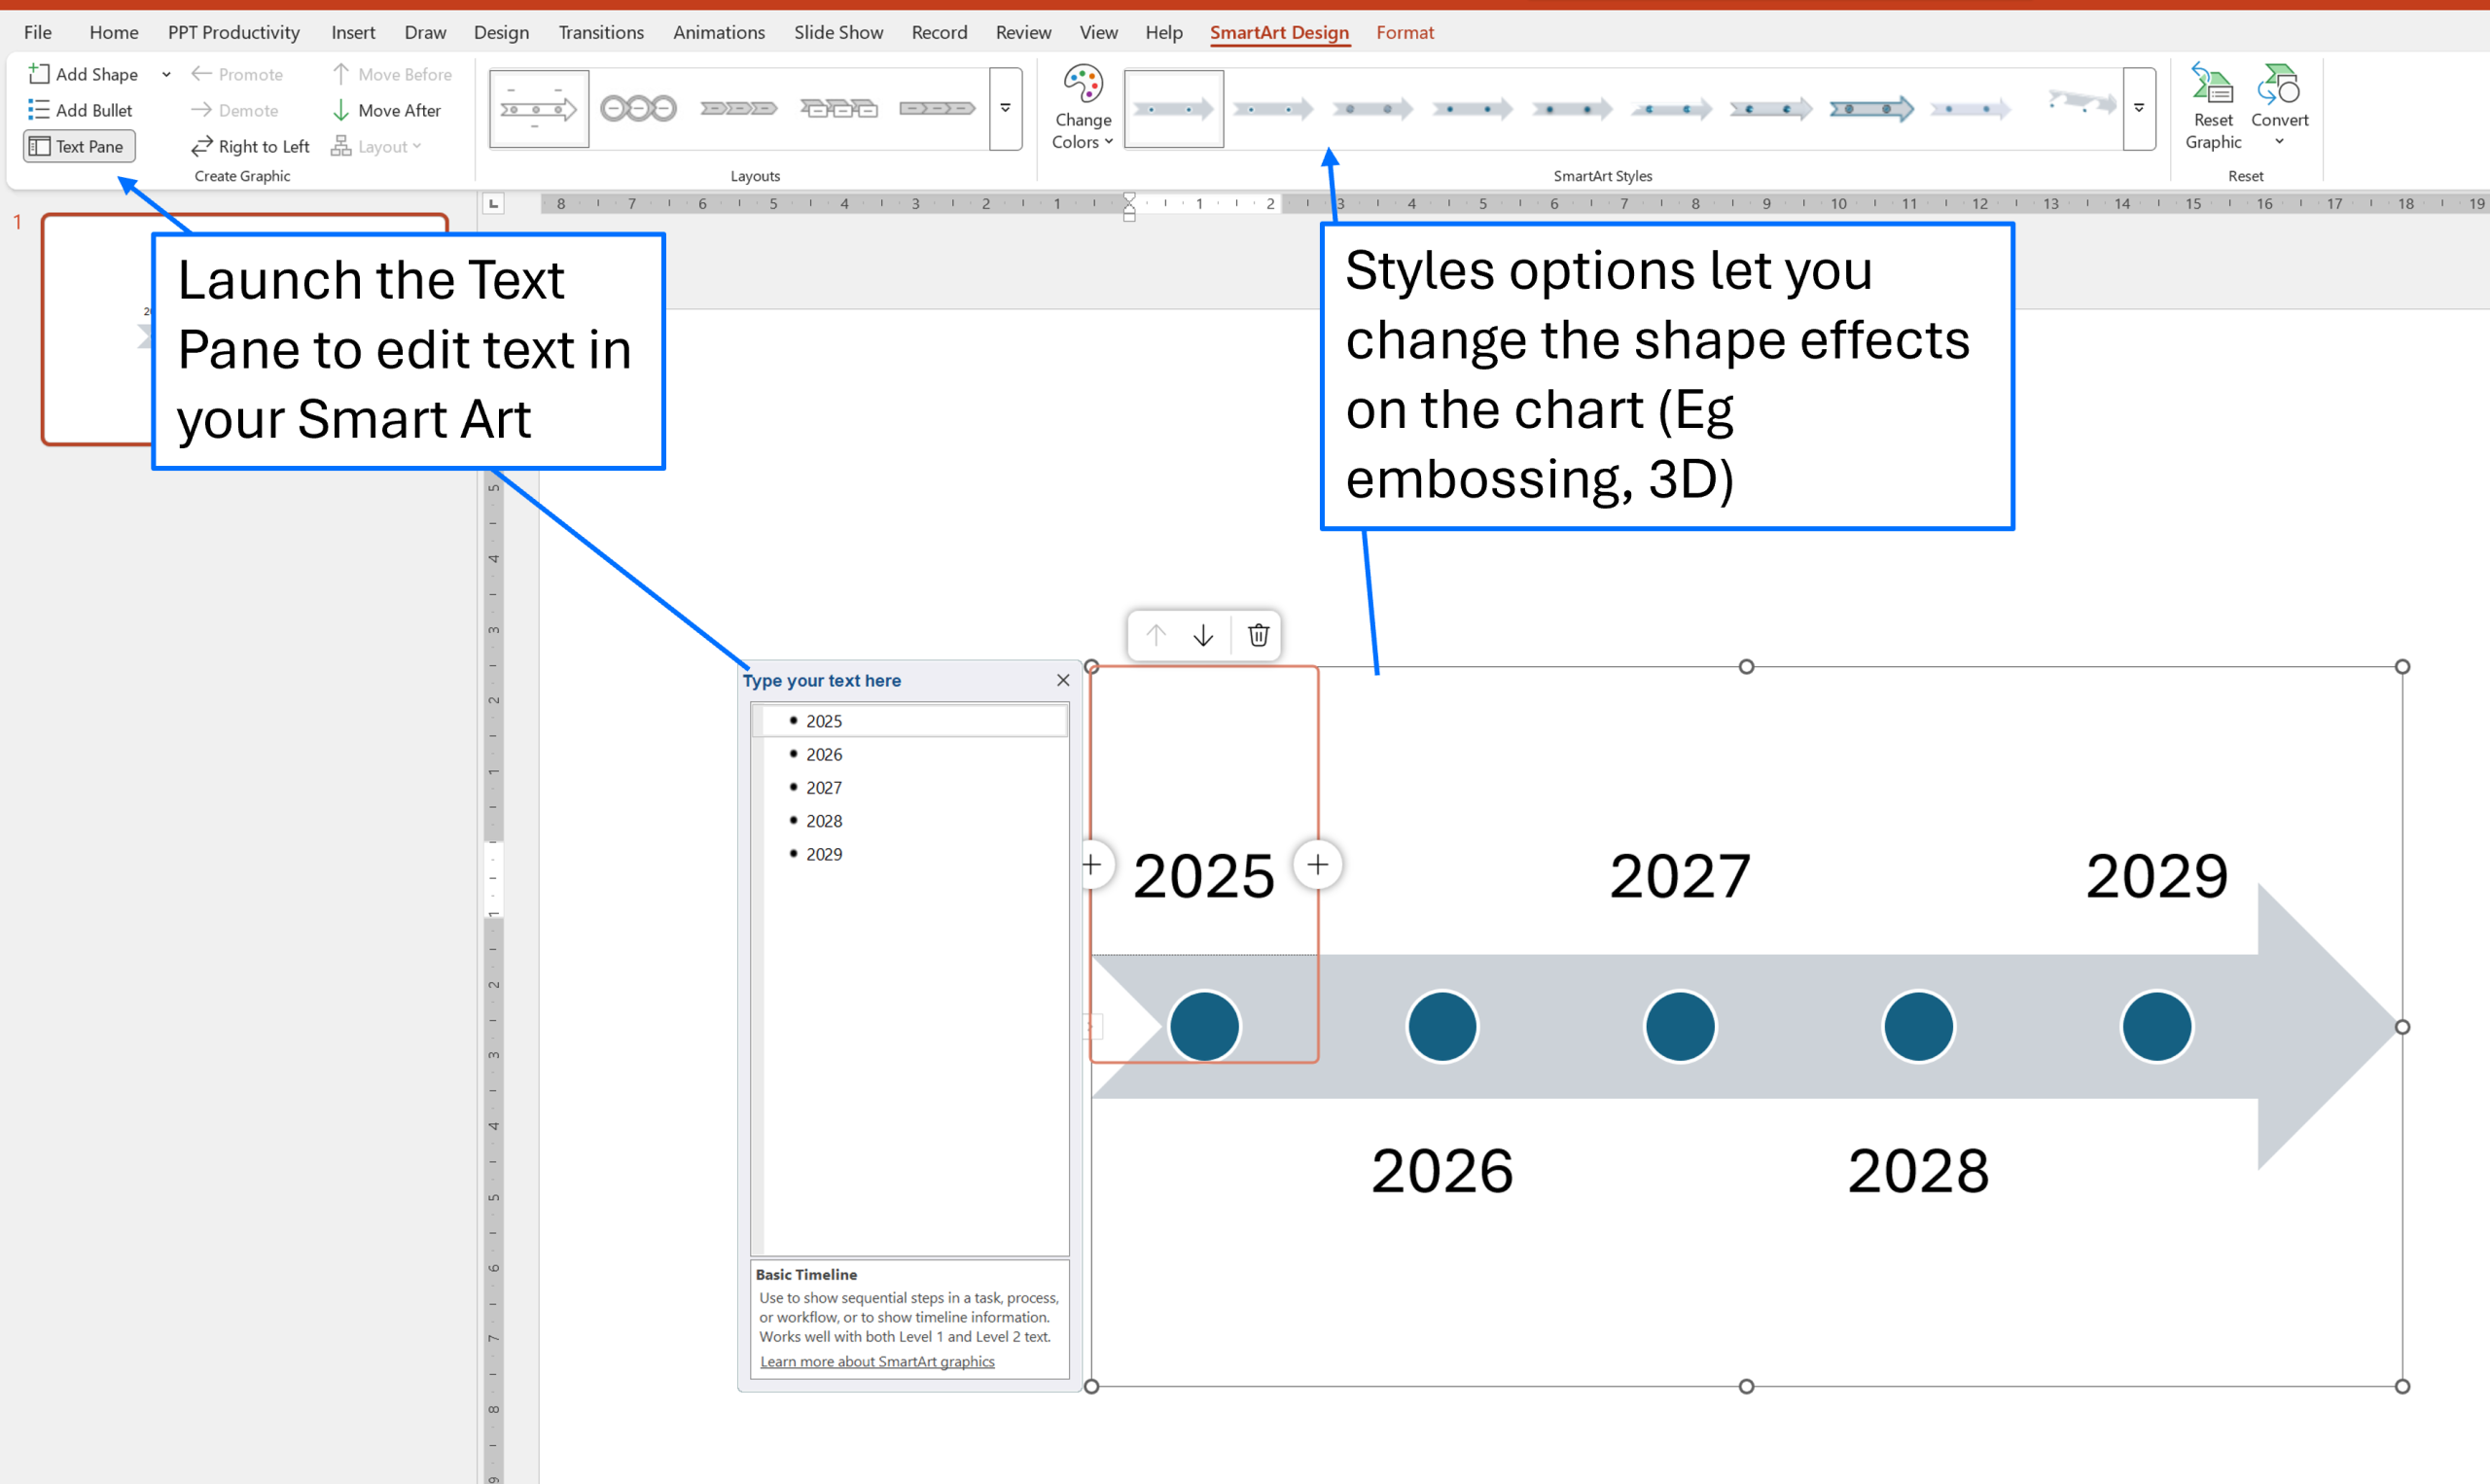
A default timeline will appear with three placeholder items. Click directly on any [Text] placeholder and type your date or milestone label. To edit all items at once, use the Text Pane - click the small arrow tab on the left edge of the SmartArt graphic to open it.
Tips for how to use the Text Pane:
The default SmartArt timeline has three milestones, but you can add or remove as many as you need.
To add a milestone: Click on an existing milestone shape, then go to the SmartArt Design tab and click Add Shape. Choose Add Shape After to add a later date, or Add Shape Before for an earlier one. You can also simply press Enter in the Text Pane to create a new item.
To remove a milestone: Select the shape on the slide (or the bullet in the Text Pane) and press Delete.
Tip: As you add more milestones, PowerPoint will automatically resize the text to fit. If your timeline is getting crowded, consider limiting it to 5-7 key milestones for readability.
Once your content is in place, you can customize the look of your timeline, to better match your presentation's theme.
Click on the SmartArt graphic, then go to the SmartArt Design tab. You'll see two main options:
Click on the outer edge of the SmartArt graphic to select the whole object (its important to select the whole object rather than just one shape). Drag the corner handles to resize your timeline, or click and drag the middle of the graphic to reposition it on the slide.
For a cleaner look, stretch the timeline to span the full width of your slide, leaving consistent margins on each side.
The SmartArt method works well for simple timelines with straightforward milestones, but it has a few common frustrations:
Keep reading for some great alternatives - Method 2 and 3 explore options for Using PowerPoint Timeline Templates.
If you're using Microsoft 365 with either the online or app variant, Microsoft now has some PowerPoint timeline templates available for you to customize and use.
To access them, from PowerPoint go to the File > New menu. You should see a search bar and a variety of templates by default.

Type Timeline into the PowerPoint online templates search bar and press enter. A variety of timeline templates for PowerPoint will display (refer to the screenshot below as an example).

Simply click on any template that you like the look of, and then click 'Create' to generate an instance of the template.

Note that the Timeline template will initially generate into the default colors and fonts.

If you select and copy the slide, then paste the slide into your PowerPoint presentation, your new Timeline slide will automatically update to apply your PowerPoint template theme colors and fonts.

If you would prefer to retain the default colors and fonts for the slide, right click and select Paste as, then select the 'Keep Source Formatting' option.
But what if you don't have Microsoft 365, or you're looking for more consulting/ project planning type timeline templates? PPT Productivity's Slide Library is another great option.
PPT Productivity's Roadmaps, Timelines and Journeys Slide Library gallery also provides a range of different timeline layout templates to make it easy for you to add timelines to your PowerPoint slides. The PPT Productivity Roadmaps, Timelines and Journeys Slide Library gallery are royalty free PowerPoint timeline templates, ready for you to insert into your presentation and customize with your text.
Choose from layouts including various timeline layouts, roadmap workplans, road timelines, chevron timelines, heat maps, and PowerPoint Gantt chart style timelines shown in the image below.

When added to your PowerPoint presentation, the Timeline template layouts will detect and apply your template theme colors. All you need to do is update the data e.g. by adding your relevant dates and milestones. In the example below, the 'Roadmap journey timeline' slide template has been pasted into a presentation and the colors in the slide have automatically updated to the presentation's theme colors.

If you would prefer to retain the default colors and fonts for the slide (the colors shown in the Slide Library thumbnail), check the 'Use Source formatting' checkbox on the Slide Library Toolbar before selecting the slide from the Library.
You can access the PPT Productivity Slide Library PowerPoint Timeline templates along with another 2000+ downloadable shapes and slides as part of the free 30 day trial of PPT Productivity Power Tools (no credit card details required to access trial, currently for PC only but Mac version in development).
PowerPoint Timeline Templates are slide layouts that make it easy to visually communicate a timeline. The timeline could be any time range e.g. common scenarios include showing the months for delivery of a transformation program, or a history of a company's evolution by acquisitions.
Timeline slides are also known as PowerPoint Journey slides or Roadmap slides. All show a progression of time, although PowerPoint roadmap templates often depict a road graphic (note that a Roadmap Template is included in PPT Productivity's Slide Library's downloadable elements).
Value Chain and Process templates are typically used for different purposes, but the chevron shapes used in process or value chain templates can also be used to depict journey slides for project delivery. PowerPoint Journey Map templates can be either chevron based (most commonly used for Customer Journey mapping slides for Customer Experience work), or take inspiration from roads to imply the journey (more common in projects like Transformation, where the slide seeks to depict the transformational journey of project change).
Along with the the 'Roadmaps, Timelines, Journeys' template slide gallery, PPT Productivity has a separate Value Chains and Processes templates for PowerPoint. In the PowerPoint Value Chains and Processes slides gallery, you have access to a Process Handoff template and various Value Chain layouts. These PowerPoint slide galleries are available in both 4:3 Standard width PowerPoint or 16:9 Widescreen PowerPoint slide size. Choose the best fit for your documents template style.

PPT Productivity's Charts Library in the Slide Library Toolbar for PowerPoint also has Gantt Chart templates available to download. The Gantt Charts will automatically update to apply your PowerPoint template theme colors when you add them to your presentation. Once you add the PowerPoint Gantt Charts to a PowerPoint slide, the Gantt charts are fully editable.

They typically focus on very different levels of detail. A timeline shows key events or milestones as a linear sequence. Timelines are typically used for history, project overviews, or roadmaps (high level overviews of projects or programs). A Gantt chart shows tasks as horizontal bars across a date range, making it easier to see duration, overlap, and dependencies between activities. Gantt charts are often very detailed.
In addition to the Roadmaps, Timelines, Journeys and Value Chains & Processes PowerPoint template libraries, PPT Productivity has 2000+ downloadable elements. Read more about the full list of PPT Productivity Downloadable Libraries.

Start your 30 day free trial - Microsoft Office for Windows
Start Free Trial